To celebrate the opening of Saturated: The Allure and Science of Color (May 11, 2018-January 13, 2019), Object of the Day this month will feature colorful objects from the exhibition. Today’s post was originally published on October 29th, 2016.
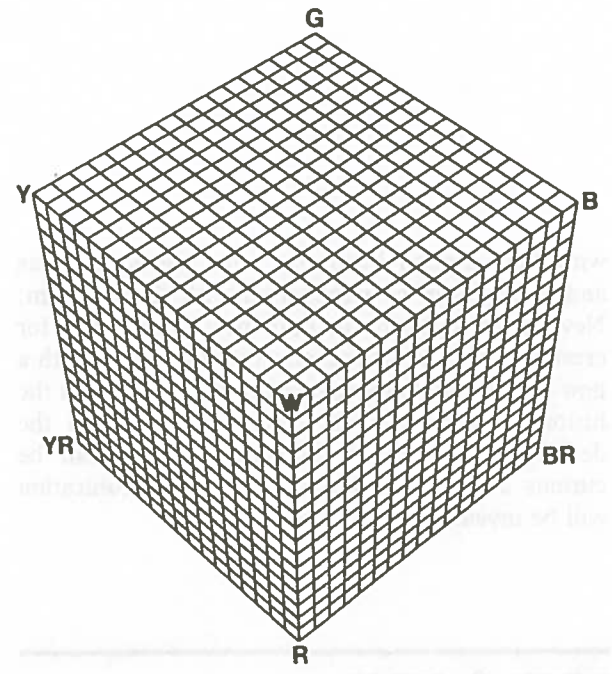
A cube split into eight floating blocks, situated in isometric perspective. Each block comprised of 49 micro-cubes. A color chart rendered in three dimensions with vertices of red, yellow, blue, green, orange, violet, white, and black (out of view).
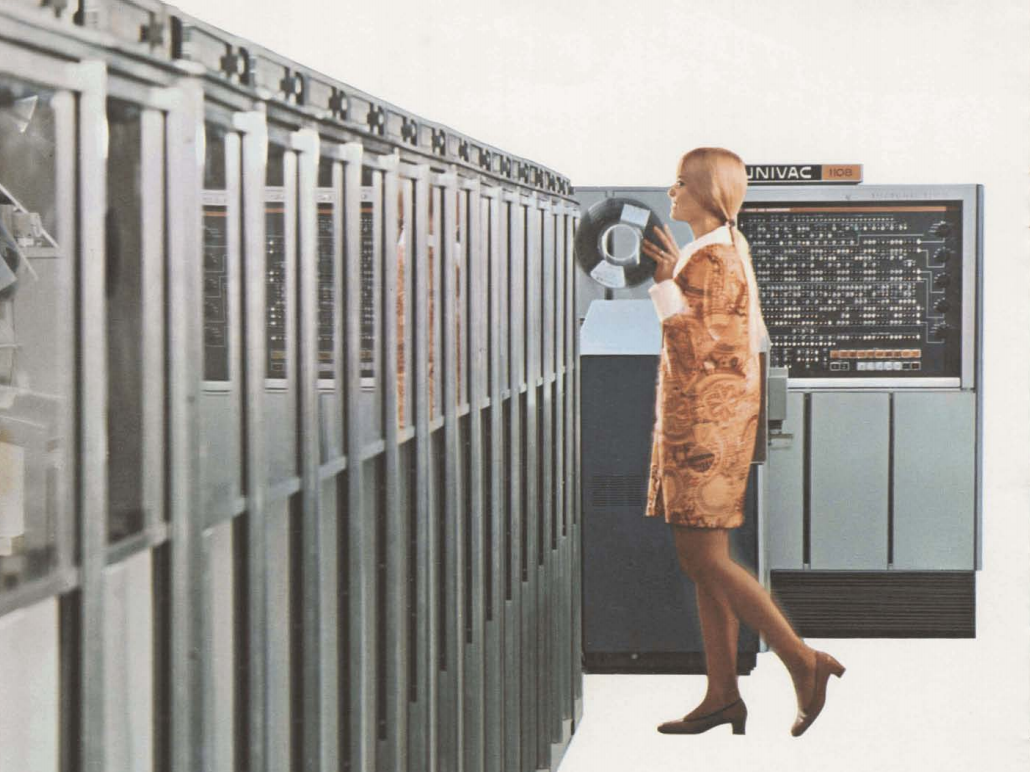
This is an ink jet plotter drawing generated by a software program called Color, developed by Mikael Jern at Lund University in the 1970s. [1] Color allowed for detailed control of the jet plotter, which rendered images with a fine array of dots. The program could create smooth color transitions by incrementally adjusting the dot density in a series of 16 steps. Color also allowed for up to 25 different dot patterns. [2] Jern’s software operated on a UNIVAC 1108 multiprocessor with memory stored on magnetic tape reels. [3] When Jern had an image script ready, he would send the tape reel to the University’s Computer Centre where it could run the print on one of two color plotters. [4]

Promotional image of the UNIVAC 1108 II. Full catalog PDF

Diagram, UNIVAC 1108 controlling plotter print heads
In 1979, Jern was using Color to create the Color Cube, a rendering that demonstrated the capability of his plotter software to apply color gradients to a 3-D rendering. [5] In 1980, Jern connected with the artist-mathematician duo Beck & Jung, Holger Bäckström and Bo Ljungberg, who continued experimenting with Color with the aid of technician, Bob Wissler. [6] Jern said of Color, that it “is a very flexible program system [that] enables programmers with little experience to generate color pictures,” so it must have made a ready point of entry for Beck & Jung. [7] Aside from demonstration prints like Color Cube, Jern used Color to plot data sets, like population density, topographic measurements, and meteorological information. [8] Beck & Jung’s experiments focused on the aesthetics of computer geometry by using Jern’s Color software to generate permutations of a cube array with various configurations of volumes and voids. [9] This drawing is an example of those experiments and is a testament to the technical capabilities of the Color software, and the unique qualities of the color plotter.

The array of 4,917 cubes that form the basis of many of Beck & Jung’s plotter drawings
- Collaborations between Engineers and Artists in the Making of Computer Art in Sweden, 1967–1986
- Color Jet Plotter
- Collaborations between Engineers and Artists in the Making of Computer Art in Sweden, 1967–1986
- Color Jet Plotter
- Collaborations between Engineers and Artists in the Making of Computer Art in Sweden, 1967–1986
- Ibid.
- Color Jet Plotter
- Ibid.
- Mathematics and Modern Art: Computer Graphics
This object will be on view in Saturated: The Allure and Science of Color beginning May 11.
Lisa Adang was formerly Product Manager in the Digital and Emerging Media department at Cooper Hewitt, Smithsonian Design Museum.

One thought on “Aesthetics of the Color Plotter”
Josh Millard on May 29, 2018 at 9:43 am
This is a very neat slice of color and computational design history!
A couple of apparent numerical errors: “Each block comprised of 49 micro-cubes…” should be 343, not 49, as it’s 7*7*7 micro-cubes per block; and the large 3D array at the bottom is not 4,917 cubes but rather 4,913 (17*17*17).